A few images from our older experiments and simulations appear below. This page is not updated frequently.
A multiple-layer crystalline suspension levitated in our GEC chamber:
J. B. Pieper, J. Goree and R.A. Quinn
Three-dimensional structure in a Crystallized Dusty Plasma
Physical Review E Vol. 54, pp. 5636-5640 1996
3D view of a bcc (body-center cubic) crystal formed by 9- micron diameter
plastic microspheres levitated in a krypton radio-frequency discharge.
This image was made bya combination of top-view images. An analog video
camera imaged particles illuminated by a horizontal sheet of laser light,
and this was repeated for various heights of the laser sheet. The stack
of images was interpolated, allowing us to present planar slices that
we chose to be aligned with the natural crystal planes. Only a small part
of the cloud is shown here. The green spots are the particles. We believe
this image is the first direct image of the 3D structure in a crystallized
dusty plasma. It appeared on the cover of Bulletin of The American Physical
Society in 1995. This is Fig. 1(a) of the paper by Pieper, Quinn & Goree
1996
Particles synthesized in a sputtering plasma
G. Praburam and J. Goree
Cosmic Dust Synthesis by Accretion and Coagulation
Astrophysical Journal Vol. 441, pp. 830-838, 1995
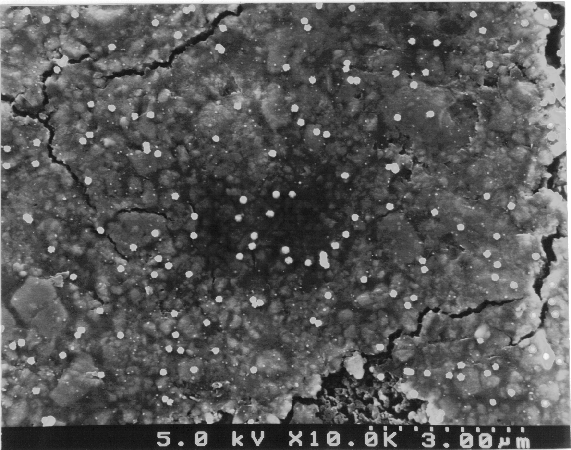
It used to be thought that having a sufficiently clean room would prevent
contamination of large dust particles in the manufacturing of silicon
wafers (and other plasma manufactured devices). Here you can see dust
actually agglomerates in the plasma to large sizes (from nanometers to
10s to even 100s of microns!) In this image you see a carbon electrode
(the background) covered with dust (the white dots). This dust was grown
in the plasma. Once the plasma is turned off, the dust falls onto the
bottom plate which is removed and taken to an electron microscope. (0.7
Meg Image)
Below are some higher magnification pictures showing the growth paterns
and varieties of dust.
(0.5 Meg Image)
Here and in the next picture you can see exactly how the dust agglomerates,
forming a coagulated structure. Maybe particles coagulated like this as
the first step in forming planets out of interstellar dust, as has been
hypothesized for the pre-solar nebula that was the precursor to our present
solar system. (0.5 Meg Image)
3D cloud of nanoparticles
G. Praburam and J. Goree
Evolution of a Particulate Cloud in an RF Plasma
IEEE Transactions on Plasma Science Vol. 24, pp. 97-98, 1996
- Here is a sequence of pictures showing how the dust cloud evolved
in the same experiments that resulted in the carbon grains shown above.
Times are shown in (min:sec). The full 2 cm-high inter-electrode region
is shown. The images are produced by a video camera looking at 90 degrees
at particles illuminated by a sheet of argon laser light. The particles
here are so small that you can't see them individually. This image is
reprinted from our paper in IEEE Trans. Plasma Sci., Special Issue on
Images in Plasma Science, 1996.

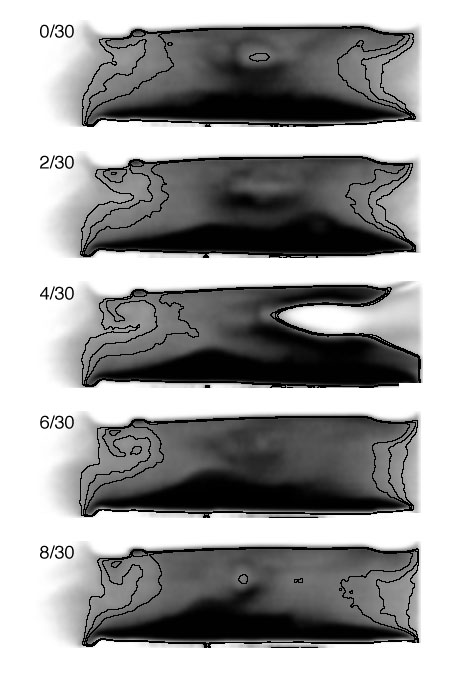
Here are more images from the same experiment, this time in black & white with two contour lines added to aid the eye in identifying features at low intensity. This is Figure 2 from our paper in Physics of Plasmas, 1996.
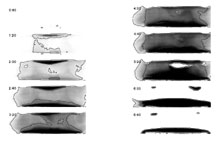
This is Figure 4 from our paper in Physics of Plasmas, 1996. It shows the rotation of the "Great Void mode"
This is Figure 5 from our paper in Physics of Plasmas, 1996. It shows the "Filamentary Mode," which has a vortex-like shape on the left side of the picture and some wispy structure in the center of the cloud.

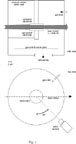
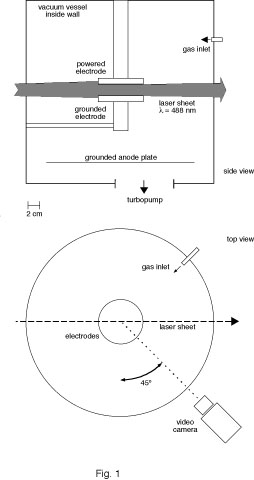
This figure shows the experimental setup used for the above figures from Physics of Plasmas, 1996


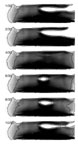
Ion wake effect simulation
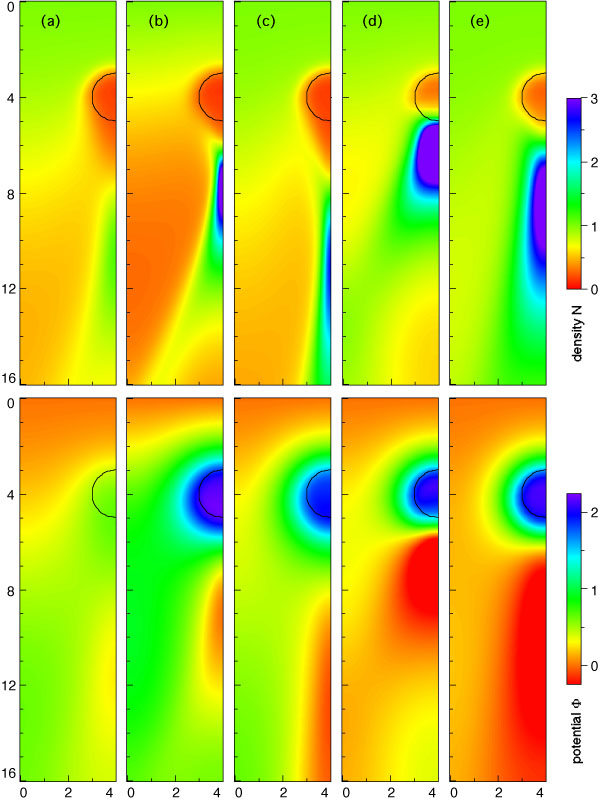
Frank Melandsoe of Tromsoe Norway visited here at The Univ. of Iowa Iowa for a year, and he wrote a self-consistent 2-fluid simulation of the supersonic flow of ions past a negatively-charged dust grain. In the upper panels you see ion density, and in the lower panels electric potential (with the sign reversed). The ion flow here is downward, from the top, at a spoeed just slightly faster than the ion acoustic speed. This is from our paper in Physical Review E, Nov. 1995. Note the ion focus region in the wake downstream of the circular dust grain; the electric potential there is positive (negative in these inverted plots) so that a negatively charged grain would be attracted there. This explains the simple-hexagonal structure that we see in some of our crystal experiments.F. MelandsØ and J. Goree
Polarized Supersonic Plasma Flow Simulation for Charged Bodies such as Dust Particles and Spacecraft
Physical Review E Vol. 52, pp. 5312-5326, 1995
Here is more from the same simulation, this time with two particles aligned
in the vertical direction.

Last updated: 27 Sept 2018